GALLERY 06 | WATER AND PUBLIC HEALTH
EXHIBIT 02/02
Covid and Access to Water
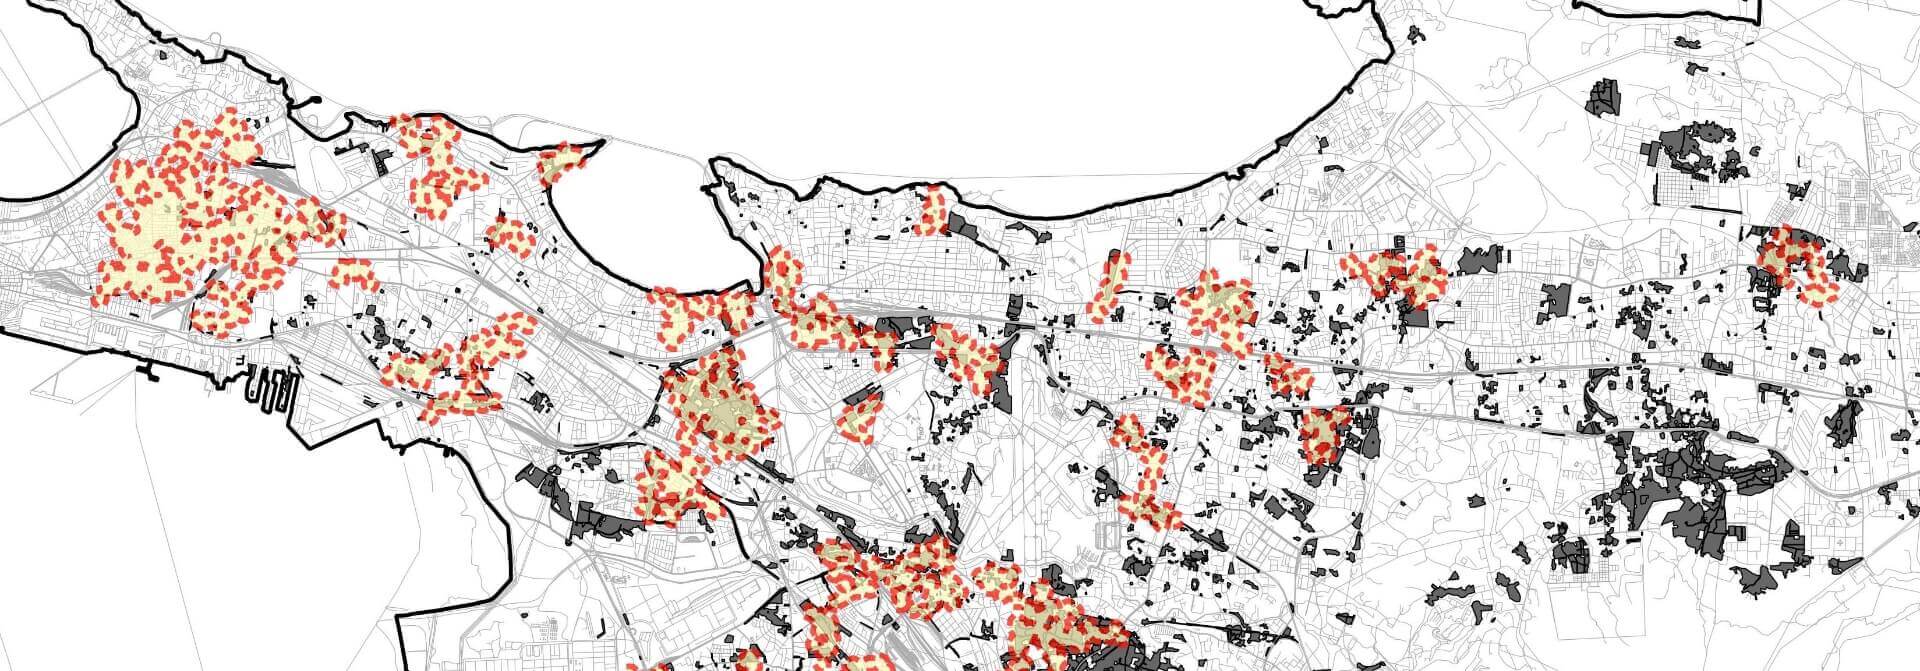
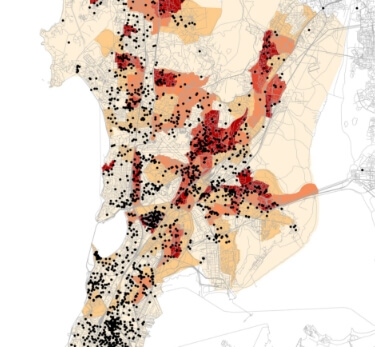
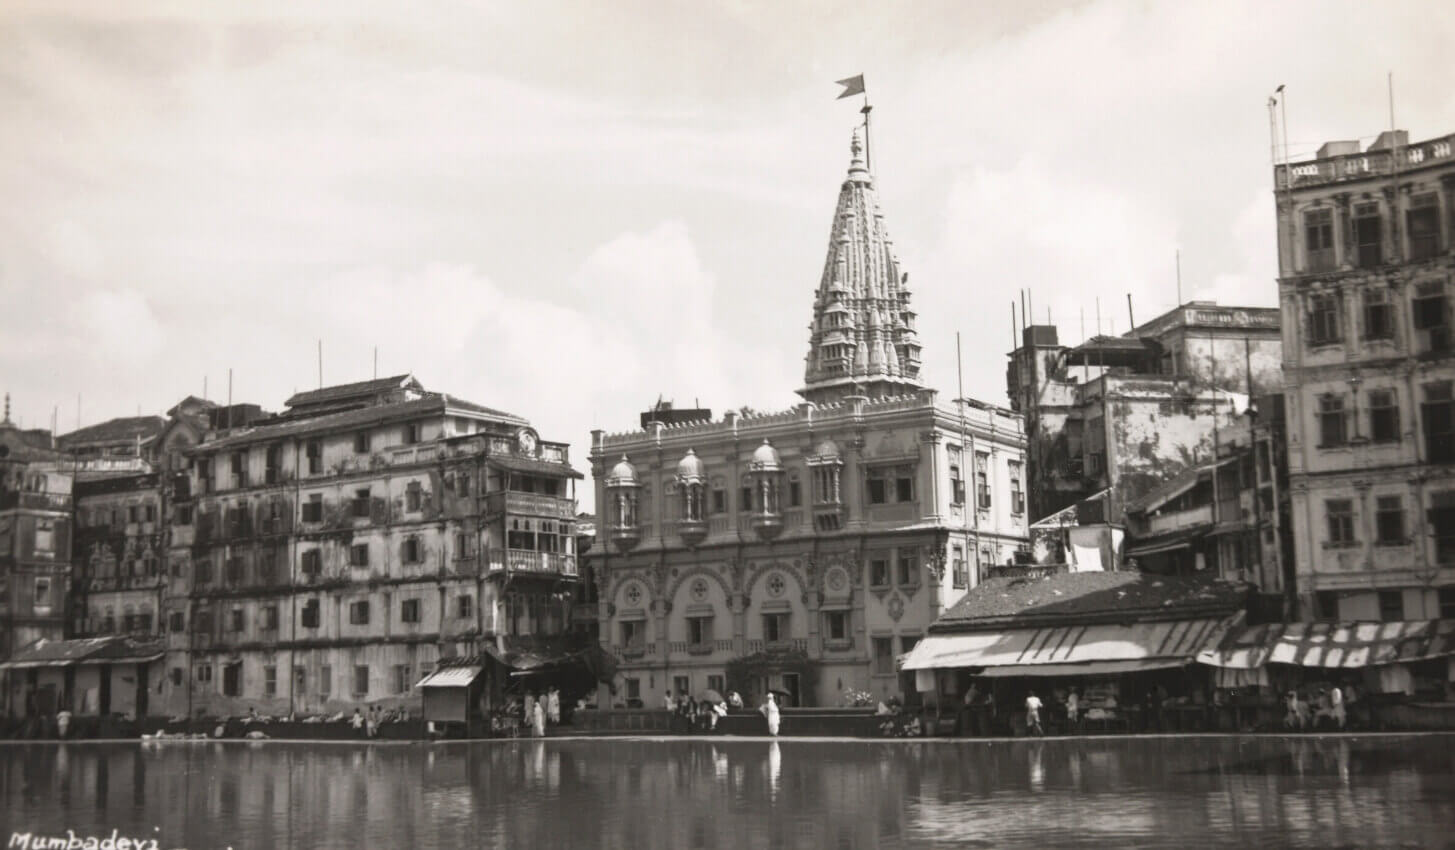
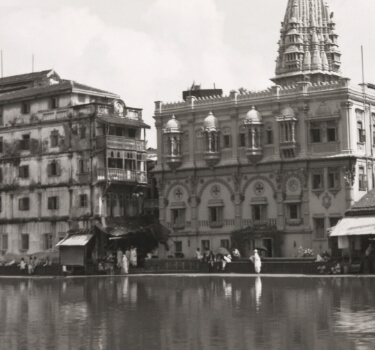
Photo Source: Abhijit Ekbote


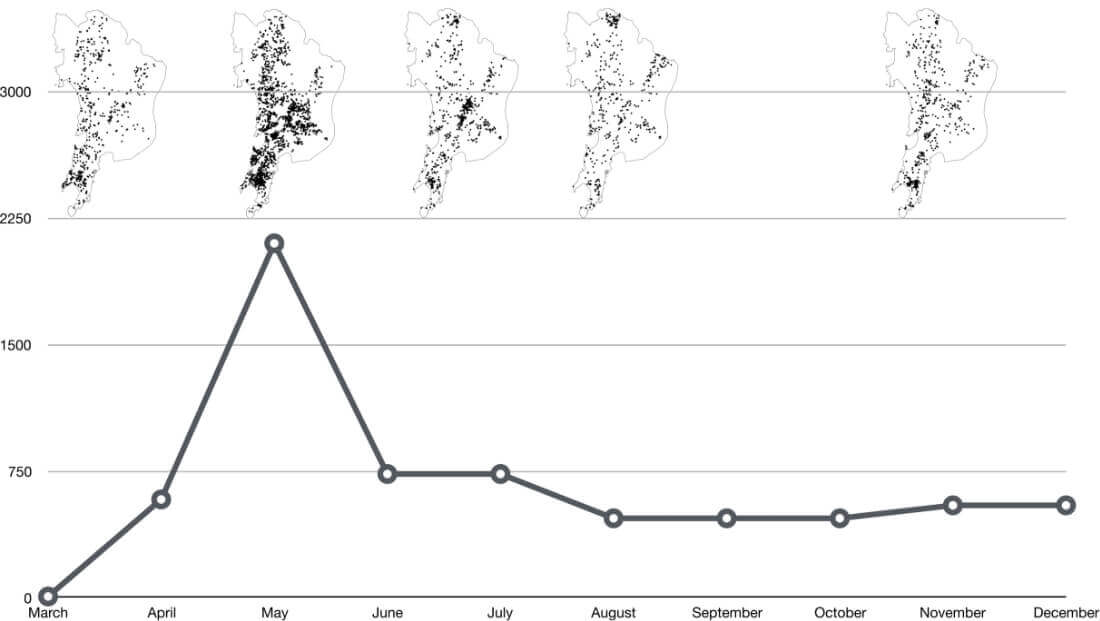
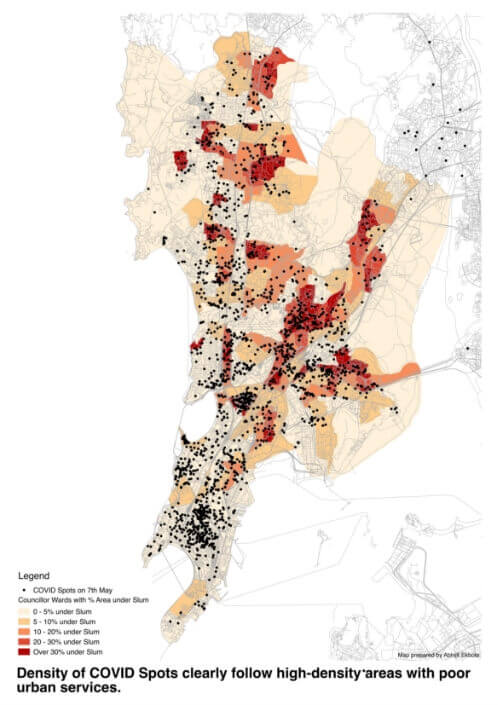
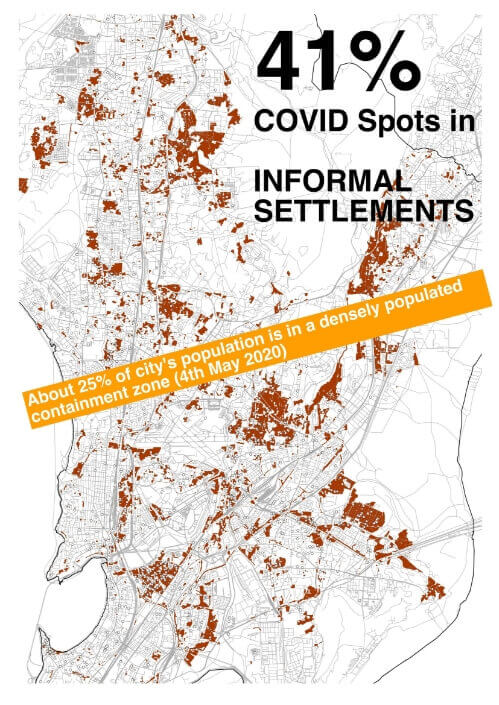
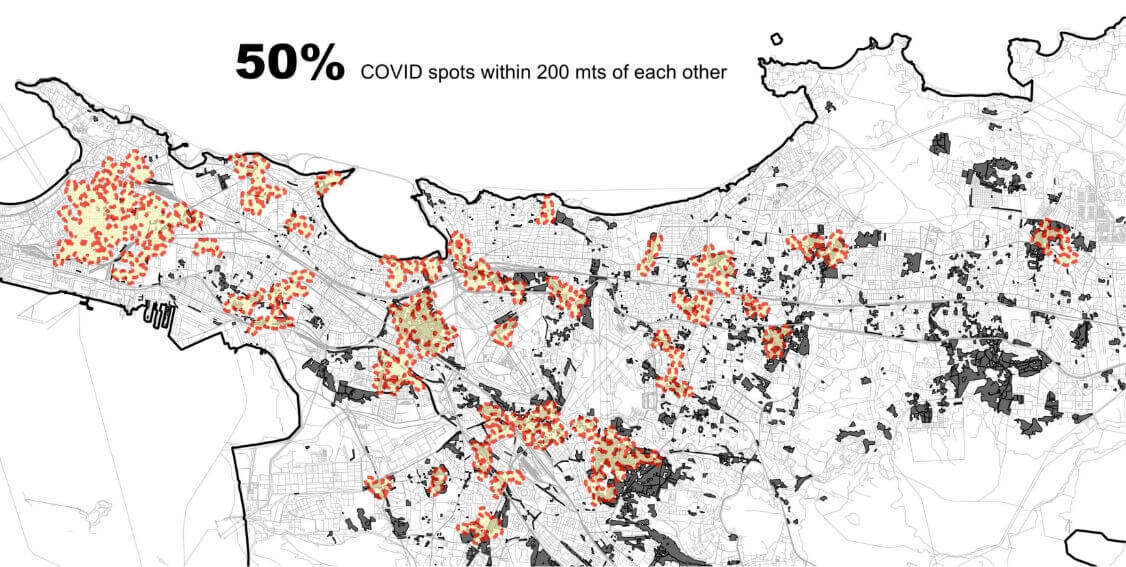
It was soon evident that COVID hotspots were mostly in areas which are unplanned or informal, having extreme resource constraints and a high population density. It was also seen that more than half of the COVID hotspots were within 200 meters
of each other and access to water in these areas is as low as 20 to 30 liters per capita per day (lpcd), whereas planned or formal areas enjoy over 135 lpcd, showing a clear relationship between COVID spread, population density and access to water.
दाटीवाटीच्या, गर्दीच्या आणि कोणत्याही नियोजनाशिवाय पसरलेल्या वस्त्यांमध्ये कोवीड केंद्र समोर येऊ लागली. इतकंच नाही तर ही केंद्र बरेचदा एकमेकांपासून जेमतेम २०० मीटर अंतरावर होती. मुख्य म्हणजे, या ठिकाणी प्रति व्यक्ती केवळ २० ते ३० लिटर पाणी पुरवठा होतो,
तर दुसरीकडे नियोजित शहरात मात्र तो पुरवठा प्रति व्यक्ती १३५ लिटरपेक्षा जास्त असतो. कोविडचा प्रसार, लोकांची दाटी आणि आवश्यक पाणी पुरवठा या सर्वांचा परस्पर संबंध यातून अधोरेखित होतो.

 BACK
BACK